Linear Regression is used to see a linear relationship between 2 quantitative variables.
The variable we’re trying to predict would be in the y-axis and would be called the response variable, or the dependent variable.
And the variable that represented on the x-axis would be the explanatory variable, or the independent variable.
Simple Linear Regression is used to model these 2 random variables, X and Y, such that for any value of random variable X=x, the predicted Y would be E(Y|X=x).
And moreover, since we’re assuming a linear relation, this value of predicted Y is

We’ll now move on with an example, and we’ll continue to understand about the different aspects of linear regression with respect to this example.
mtcars is a built-in dataframe in r and comprises of fuel consumption and 10 other aspects of automobile design and performance for 32 automobile. For our example, we’ll be observing the relationship between the car’s weight and it’s displacement.
plot(mtcars$wt, mtcars$disp, xlab = "Weight", ylab = "Displacement", title("Weight vs. Displacement"))This produces the following output :
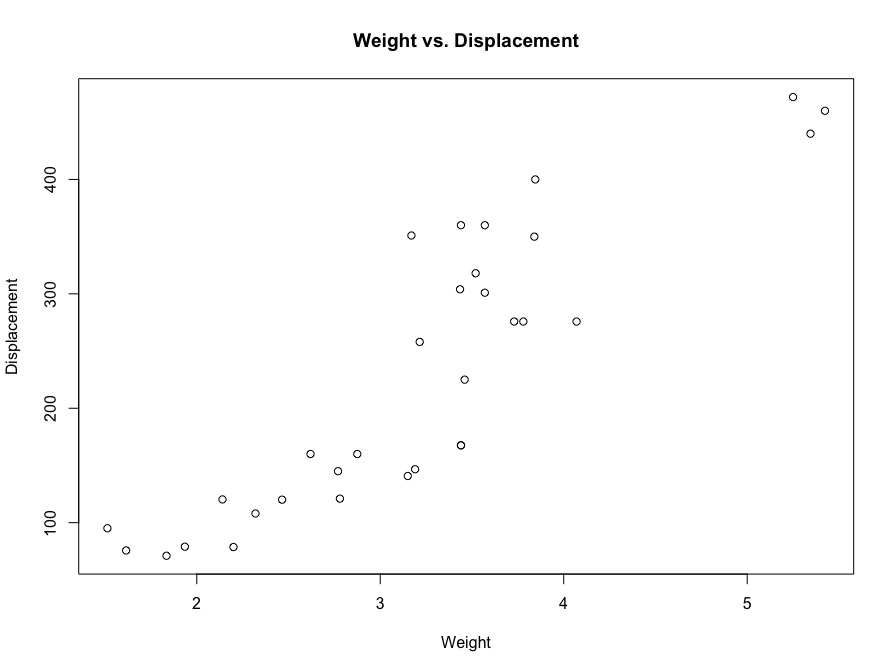
We can clearly see that with respect to the the 2 random variables X and Y, are somewhat cor

Leave a comment